Pet grooming · UAE
Dubai Pet Groomer
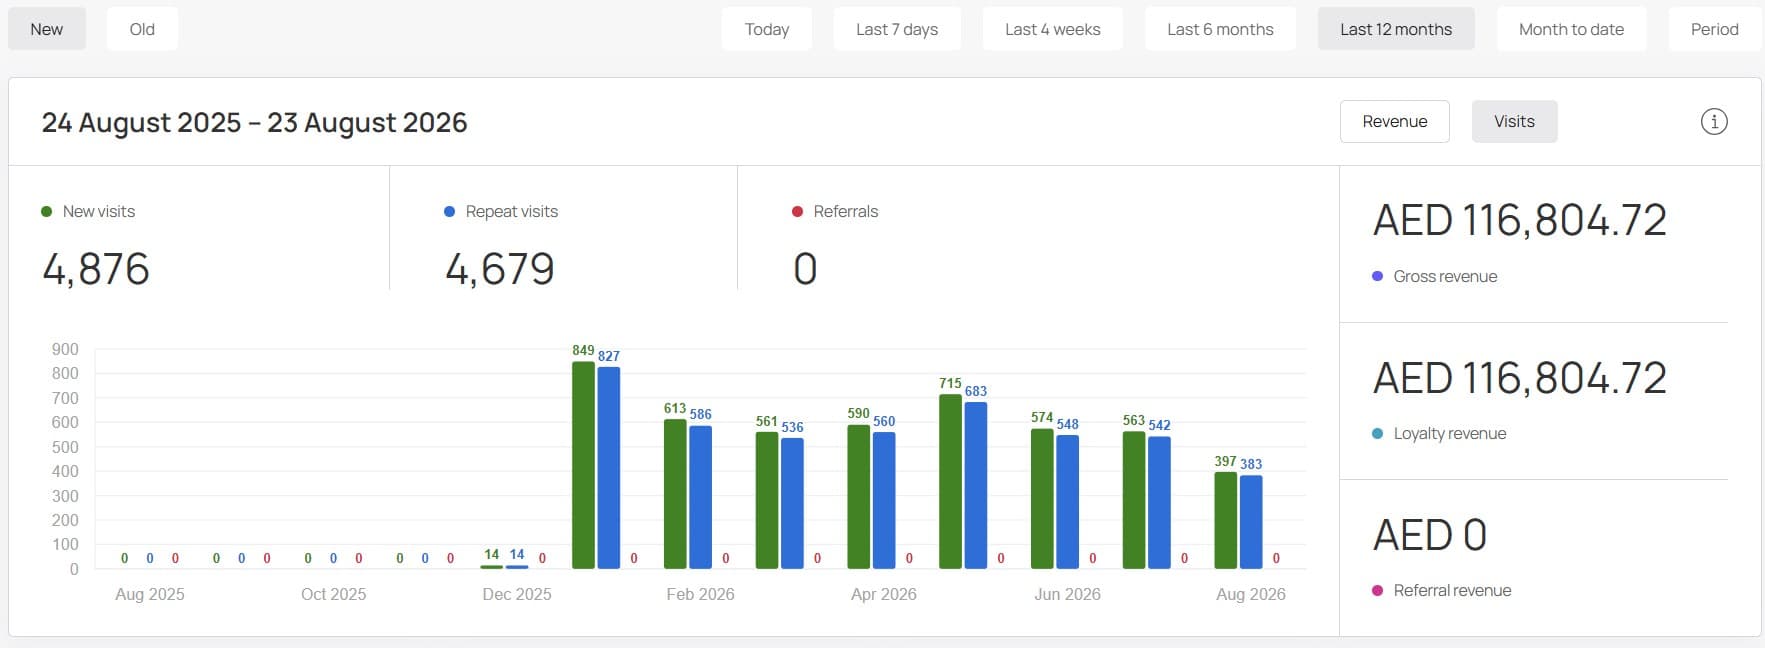
4,679
repeat visits tracked
4,876
new visits tracked
AED 116,804.72
loyalty revenue recorded
12-month dashboard view, 24 Aug 2025 to 23 Aug 2026
Founding 2050% off your first yearUS$330 instead of US$66020 of 20 spots remaining
Claim a spot →Loyal-T Cards results
Real examples from loyalty programs tracked through the Loyal-T Cards platform.
Dashboard figures describe recorded activity. Results vary, and the figures do not prove that Loyal-T Cards caused every visit or revenue amount.
Case studies
A pet-grooming business in the UAE and a specialty cafe in Dubai. Each case study shows the dashboard screenshot the figures come from.
Pet grooming · UAE
4,679
repeat visits tracked
4,876
new visits tracked
AED 116,804.72
loyalty revenue recorded
12-month dashboard view, 24 Aug 2025 to 23 Aug 2026
Cafe · JLT, Dubai
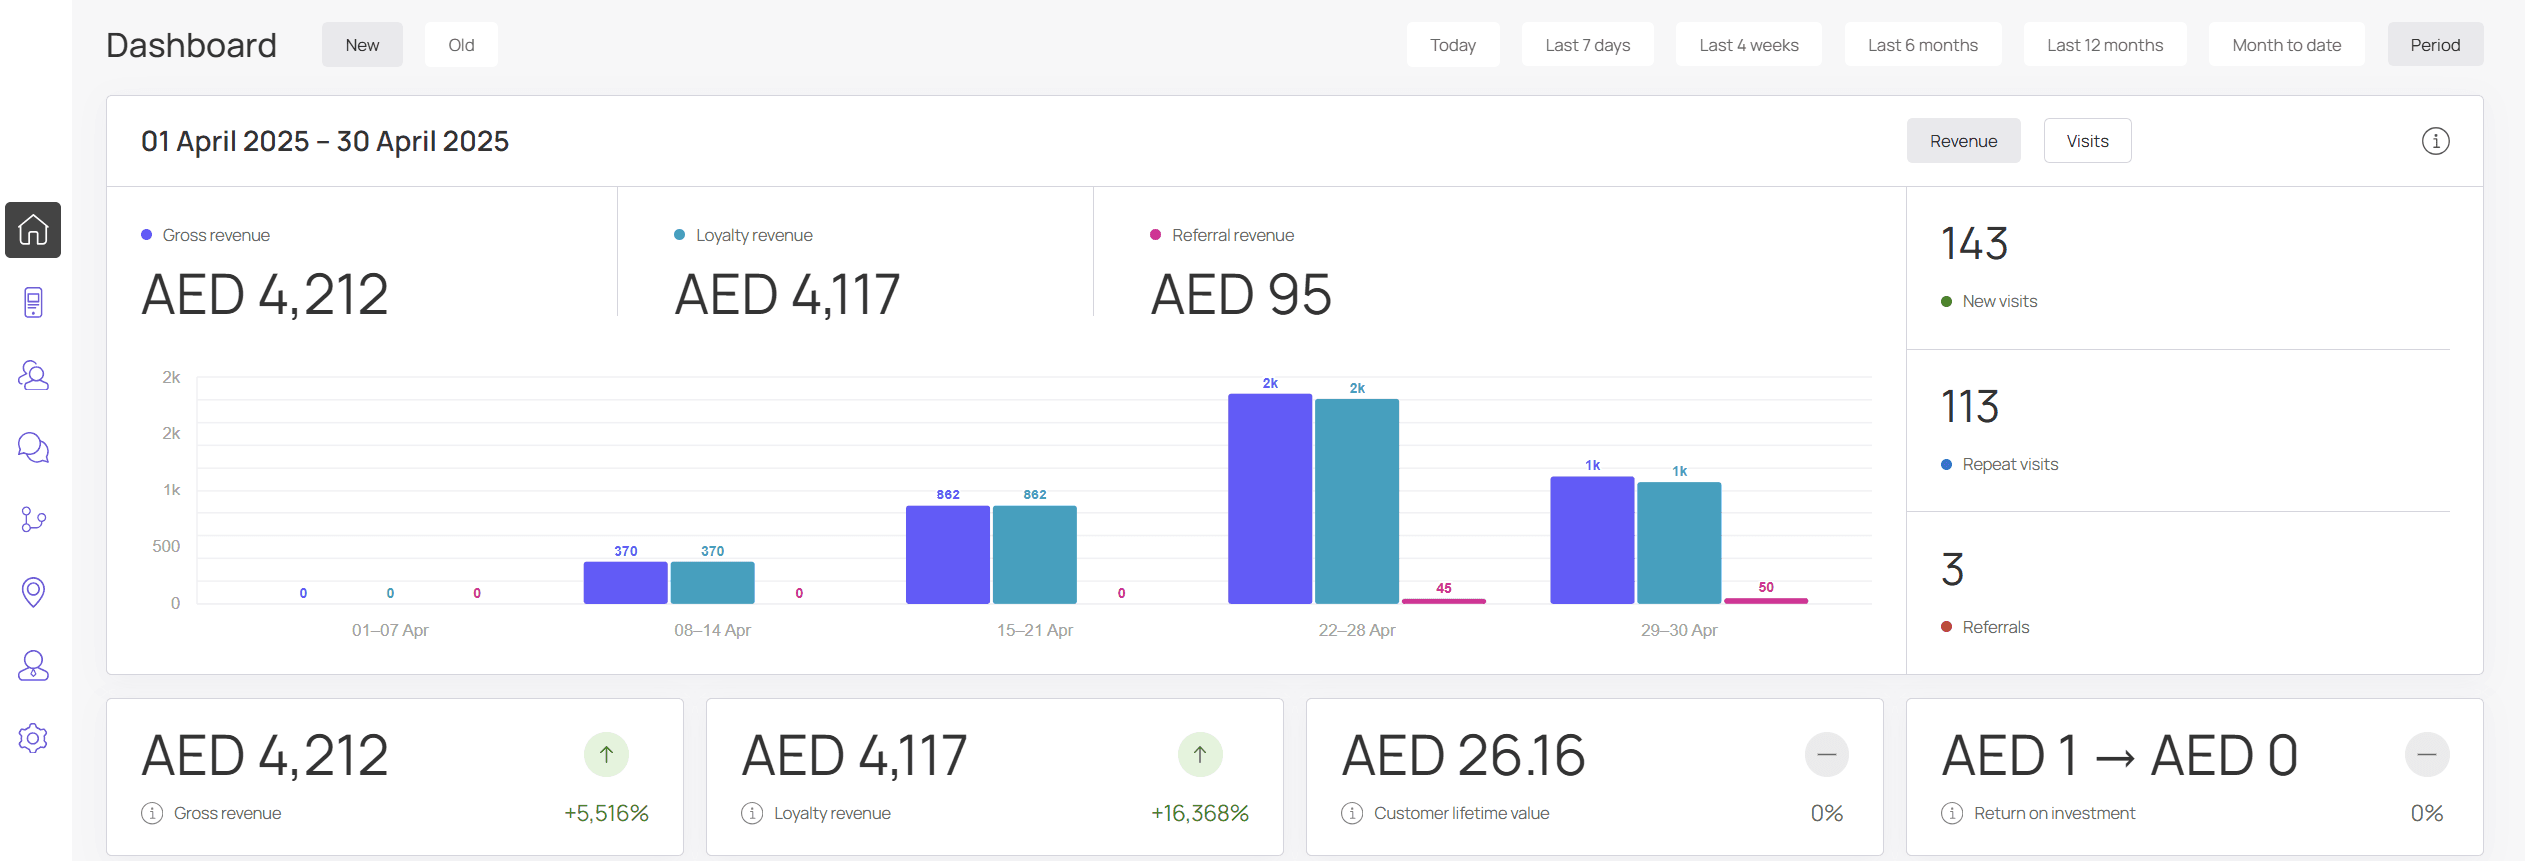
AED 4,117
loyalty revenue recorded
143
new visits tracked
113
repeat visits tracked
1 to 30 April 2025, single location
Actual Loyal-T Cards customer dashboard data. Results vary. Figures describe activity recorded through the loyalty program and do not establish that Loyal-T Cards caused every visit or revenue amount.
Reading the figures
We publish dashboard data because it is the most honest evidence we have. It is worth being precise about what it can and cannot tell you.
Loyal-T Cards dashboards can record loyalty activity, including new visits, repeat visits and loyalty-linked revenue, as your team records it through the platform.
The figures show what was recorded through the program in the selected period. They are reported here exactly as the dashboard displays them, with the period stated each time.
They do not, by themselves, prove that the platform caused every customer behaviour or transaction, and they do not predict what another business will record.
Both businesses keep running their own booking, ordering and payment systems. Loyal-T Cards is a separate loyalty platform: their teams record loyalty activity through it, and the dashboard shows what was recorded.
One annual plan, US$660/year for one business location. We set it up. Your team runs it.